Hadoop NameNode Web Interface
In my previous post I discussed the Hadoop Distributed File System's metadata, in the form of the fsimage file that is a point-in-time representation of the filesystem and the edits file which is a log/journal of filesystem changes. I showed you how the fsimage and edits files can be retrieved via HTTP.
Over a series of posts I'll provide an overview of the web interfaces for each of the Hadoop daemons the NameNode, Secondary NameNode (or checkpoint node), DataNode, JobTracker and TaskTracker. The web interface for these services provide a information rich view of the status of each of these components. They are great as a first port of call to obtain a view of the state of a Hadoop cluster.
The NN web interface can be accessed via the URL http://<namenode_host>:50070/ assuming you have not changed the port that the service listens on in the configuration.
The first part of the page displays the name of the server running the NameNode and the port, when it was started, version information etc. In case you were wondering what the string of characters in version information after the comma was, it is the revision number from the subversion source code repository for Hadoop.
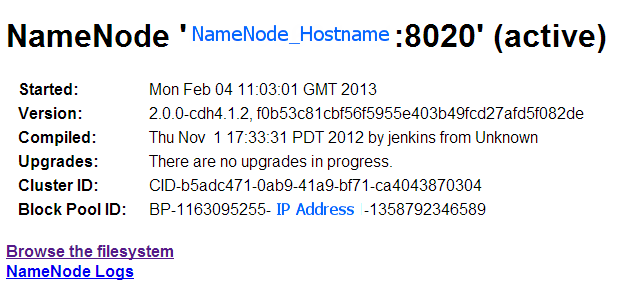 The Cluster ID is a unique string that identifies the cluster all nodes in the cluster will have the same ID (you can specify your own value for this).
With Hadoop 1.0/CDH3 it was only possible to have a single NameNode to manage the entire file system namespace. Since this limited scalability forvery large clusters and to cater for other requirements of multi-tenancy the concept of federating the namespace across multiple NameNodes was developed, so for example you could have nn1 responsible for the metadata and blocks associated with /sales and nn2 for /research. In this scenario a NN manages what is termed a NameSpace Volume which consists of the filesytem metadata and the blocks (block pool) for the files under the 'volume'. The DataNodes in a federated cluster store blocks for multiple NameNodes, and the Block Pool ID is used to identify which NN blocks belong to. The Block Pool ID is derived by concatenating the prefix BP with some random characters, the NameNode IP address and the current time in milliseconds.
The next part of the web interface displays a summary of the state of the cluster.

The screenshot below shows the message displayed when Safe mode is on.


Simlarily the dead nodes provides information on nodes that are out of contact with the NameNode (i.e. either the physical server or daemon/service has crashed). Decomissioned nodes are those which have been administratively removed from the cluster (you may do this to perform maintenance). Clicking on the link for the node in the list will take you to the web interface for the DataNode in question.
You can also view the NameNode logs and browse the file system from the web UI. Clicking browse the file system will actually take you to the web interface of one of the DataNodes (since the actual data is stored on the DataNodes and the NameNode only stores metadata).

http://<namenode_host>:50070/contentSummary?ugi=hdfs,groups
- returns statistics about a directory such as, length (size), fileCount, directoryCount, quota, spaceConsumed and spaceQuota. Where the ugi parameter ugi specifies the user and group that the command will be executed as. In the example above this just returns information for the root ('/') of the filesytem but we can specify any path under HDFS (permissions permitting) such as /contentSummary/user/?ugi=hdfs,groups


FSCK Servlet
The File System Check (FSCK) servlet performs a file system consistency check on HDFS. It's not a good idea to run this on a busy production cluster during core hours.
This servlet is equivalent to running the hadoop fsk from the command line, and like the command line utility the servlet supports the blocks, files, locations and racks parameters (refer to the command guide for information on what the parameters mean) - which lists files, the blocks the consist of and the nodes on where the block replicas reside.
http://<namenode>:50070/fsck?ugi=hdfs,groups

Over a series of posts I'll provide an overview of the web interfaces for each of the Hadoop daemons the NameNode, Secondary NameNode (or checkpoint node), DataNode, JobTracker and TaskTracker. The web interface for these services provide a information rich view of the status of each of these components. They are great as a first port of call to obtain a view of the state of a Hadoop cluster.
NameNode (NN)
The NN web interface can be accessed via the URL http://<namenode_host>:50070/ assuming you have not changed the port that the service listens on in the configuration.
The first part of the page displays the name of the server running the NameNode and the port, when it was started, version information etc. In case you were wondering what the string of characters in version information after the comma was, it is the revision number from the subversion source code repository for Hadoop.
The Cluster ID is a unique string that identifies the cluster all nodes in the cluster will have the same ID (you can specify your own value for this).With Hadoop 1.0/CDH3 it was only possible to have a single NameNode to manage the entire file system namespace. Since this limited scalability forvery large clusters and to cater for other requirements of multi-tenancy the concept of federating the namespace across multiple NameNodes was developed, so for example you could have nn1 responsible for the metadata and blocks associated with /sales and nn2 for /research. In this scenario a NN manages what is termed a NameSpace Volume which consists of the filesytem metadata and the blocks (block pool) for the files under the 'volume'. The DataNodes in a federated cluster store blocks for multiple NameNodes, and the Block Pool ID is used to identify which NN blocks belong to. The Block Pool ID is derived by concatenating the prefix BP with some random characters, the NameNode IP address and the current time in milliseconds.
Cluster Summary
The next part of the web interface displays a summary of the state of the cluster.
Safe Mode
When the NameNode starts up it loads the fsimage file into memory and replays the changes from the edits file and waits until the DataNodes in the cluster check-in with the NameNode to report the blocks they have. During this time the NameNode will remain in Safe Mode (effectively a sort of read-only state). It will only exit from Safe Mode once it has completed this process and until a configured percent (default is 99.9%) of blocks are reported to be online by the DataNodes. In practice the NameNode actually waits 30 seconds after this condition is reached before exiting safe mode.The screenshot below shows the message displayed when Safe mode is on.
NameNode Journal and Metadata Storage
The last part shows the status of the NameNode journal (i.e. the edits file) and NameNode metadata storage directories.Live Nodes
As you might expect clicking the Live Nodes link takes you to a page that displays statistics on nodes that are up and in contact with the NameNode.Simlarily the dead nodes provides information on nodes that are out of contact with the NameNode (i.e. either the physical server or daemon/service has crashed). Decomissioned nodes are those which have been administratively removed from the cluster (you may do this to perform maintenance). Clicking on the link for the node in the list will take you to the web interface for the DataNode in question.
You can also view the NameNode logs and browse the file system from the web UI. Clicking browse the file system will actually take you to the web interface of one of the DataNodes (since the actual data is stored on the DataNodes and the NameNode only stores metadata).
NameNode Metrics via JMX
The NameNode like other Hadoop daemons exposes metrics (JVM memory usage, HDFS capacity, used storage etc) using Java Mangement Extensions (JMX), you accessing the URL http://<namenode_hostname>:50070/jmx will provide a JSON formatted list of metrics and their values.Content Summary Servlet
The content summary servlet which is called as follows:http://<namenode_host>:50070/contentSummary?ugi=hdfs,groups
- returns statistics about a directory such as, length (size), fileCount, directoryCount, quota, spaceConsumed and spaceQuota. Where the ugi parameter ugi specifies the user and group that the command will be executed as. In the example above this just returns information for the root ('/') of the filesytem but we can specify any path under HDFS (permissions permitting) such as /contentSummary/user/?ugi=hdfs,groups
List Path Servlet
The list path servlet allows you to perform a directory listing of HDFS.
http://<namenode>:50070/listPaths/SOMPATH/?ugi=hdfs,groups
In addition to the ugi parameter, this servlet supports filter, exclude and recursive parameters.
FSCK Servlet
The File System Check (FSCK) servlet performs a file system consistency check on HDFS. It's not a good idea to run this on a busy production cluster during core hours.
This servlet is equivalent to running the hadoop fsk from the command line, and like the command line utility the servlet supports the blocks, files, locations and racks parameters (refer to the command guide for information on what the parameters mean) - which lists files, the blocks the consist of and the nodes on where the block replicas reside.
http://<namenode>:50070/fsck?ugi=hdfs,groups
Comments
Post a Comment